Newboot provides a rich suite of features purpose-built to manage industrial data at scale, from raw sensor acquisition to digital twin orchestration and edge-deployed AI. Each module of the platform is designed to be both standalone and interoperable, ensuring flexibility in deployment while maintaining a consistent and standardized data model across factories, sectors, and use cases.
The following subsections outline the core capabilities of the platform, available through the Newboot Webapp, Edge runtime, and backend infrastructure.

Dashboard #
The Newboot Dashboard provides a real-time, customizable view into operational data across sites and assets. With it, users can:
- Visualize any variable or digital twin in gauges, charts, or logs
- Track metrics like machine status, environmental conditions, or energy usage
- Compare asset performance across different zones or sites
- Configure threshold alerts and status indicators (e.g., red/yellow/green)
- Pin KPIs or tags from specific devices for operator visibility
Dashboards are accessible per site or user role and can be shared with external systems via API.
IoT Platform #
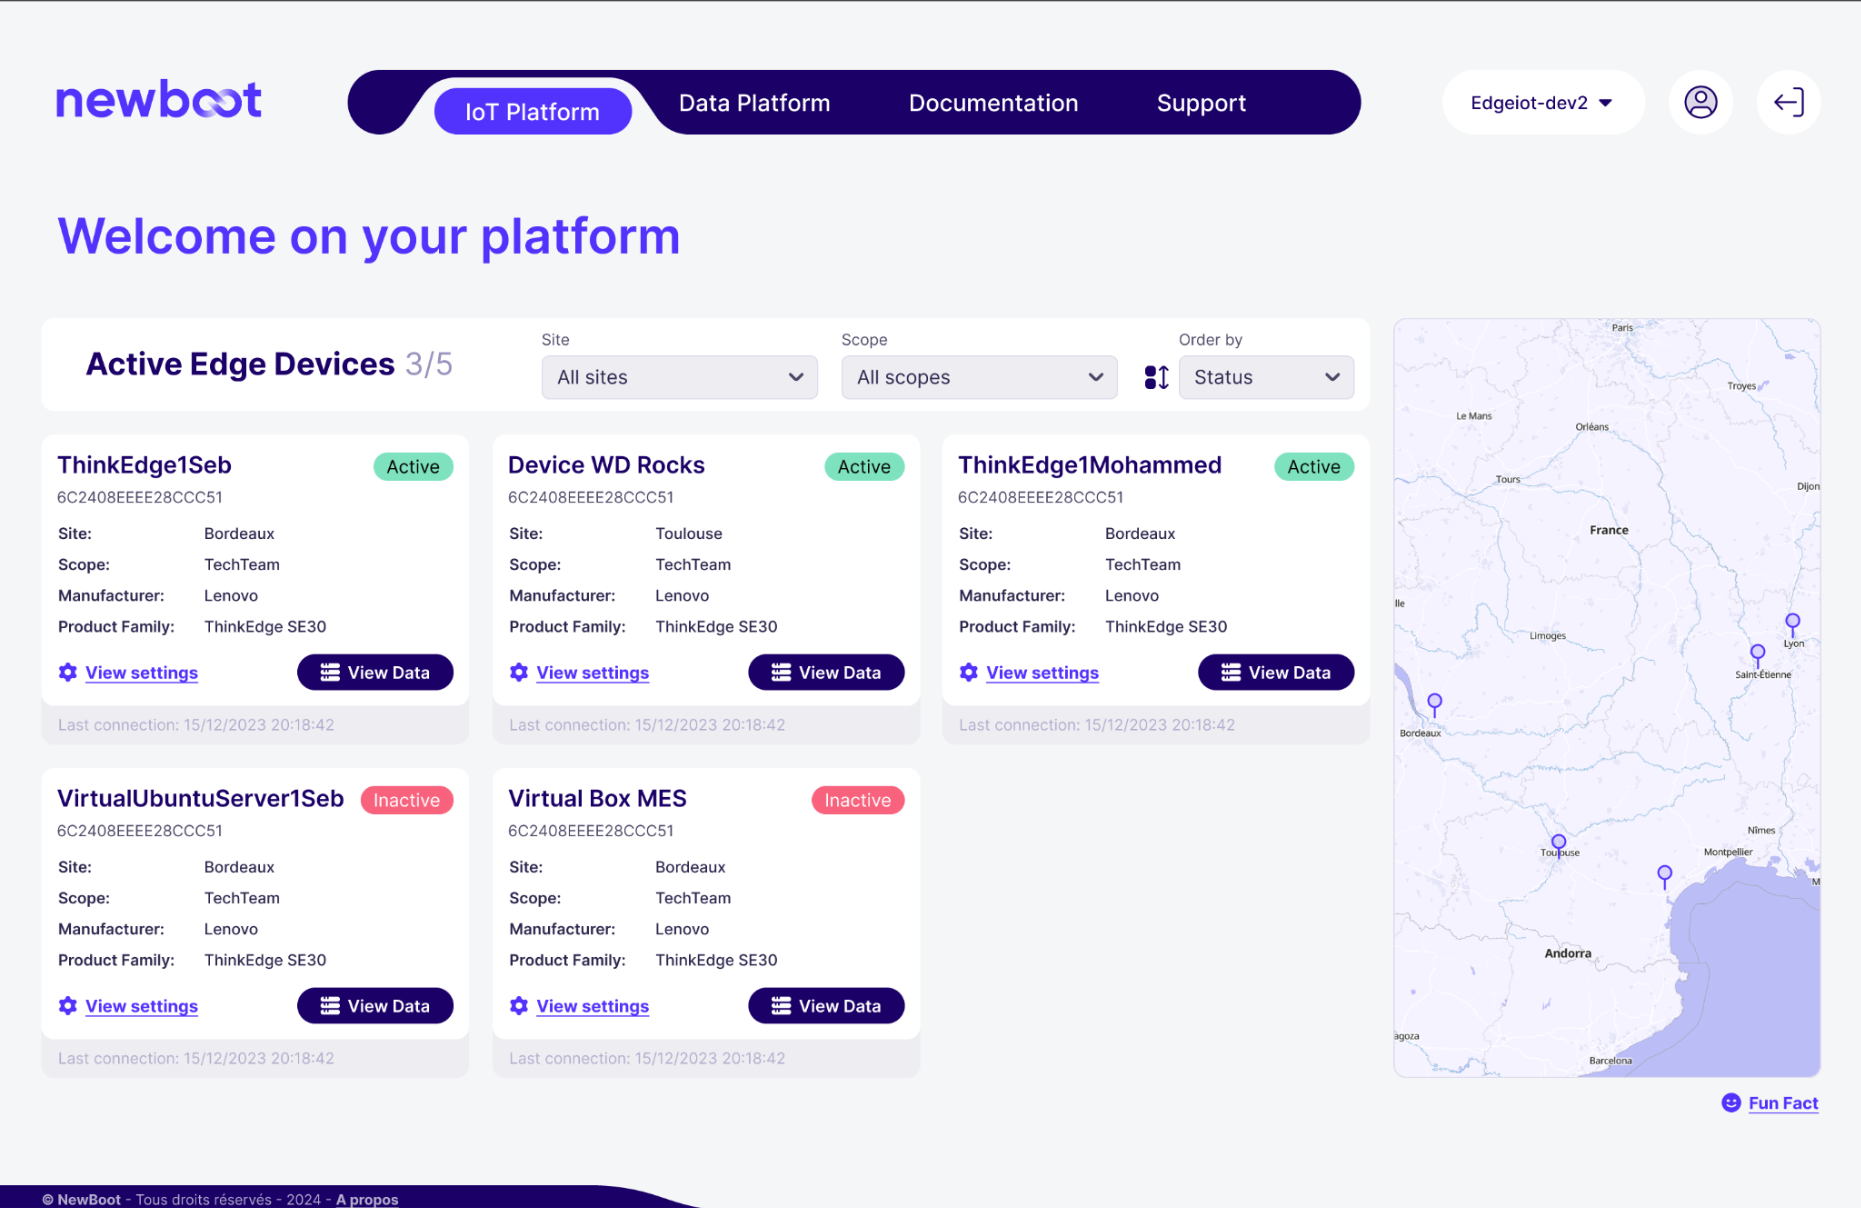
The IoT Platform is where all connectivity and data acquisition are defined. This includes:
- Protocol Configuration: Activate and set parameters for protocols like Modbus, OPC UA, MQTT, Profinet, LoRaWAN, etc.
- Modular Architecture: Each protocol runs in its own secure, containerized environment
- Dynamic Drivers: Support for plug-and-play field devices, custom protocol extensions
- Connectivity Monitoring: Track communication status, errors, and data latency
- Variable Standardization: Configure names, types, units, scaling, and update logic
With the IoT Platform, users gain complete control of their field communication landscape.

Data Platform #
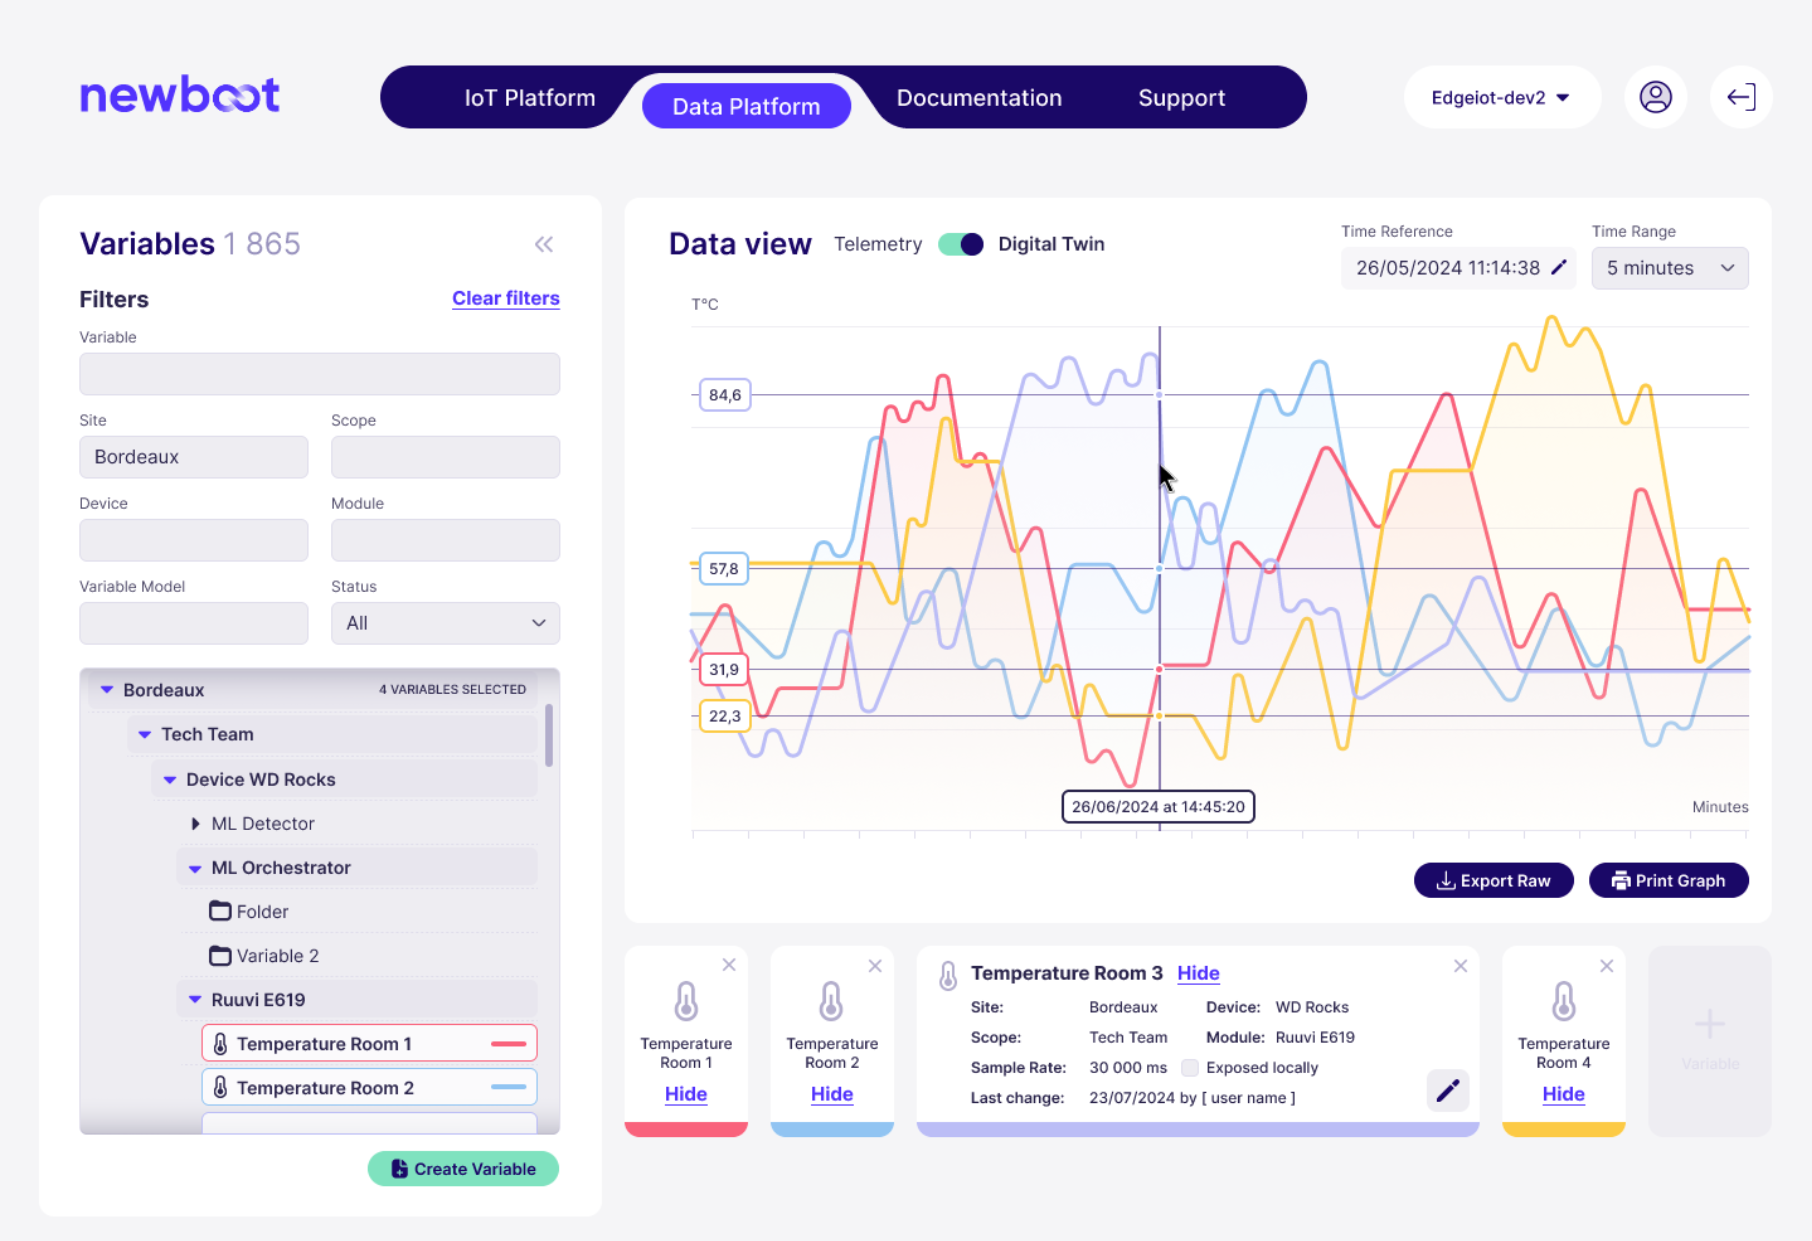
The Newboot Data Platform transforms raw signals into structured, contextualized, and analytics-ready datasets.
- Data Stream Management: Real-time data flows from edge to cloud or local databases
- Time-Series Storage: High-throughput, scalable database for logging and querying
- Tag Metadata: Enrich tags with units, descriptions, categories, and quality indicators
- Labeling Tools: Automatically or manually annotate data for ML pipelines
- Third-Party Integration: Export to cloud, ERP, or MES via API or MQTT bridge
The platform is optimized for high-speed, high-volume industrial workloads with multi-site ingestion and low latency.

Digital Twins #
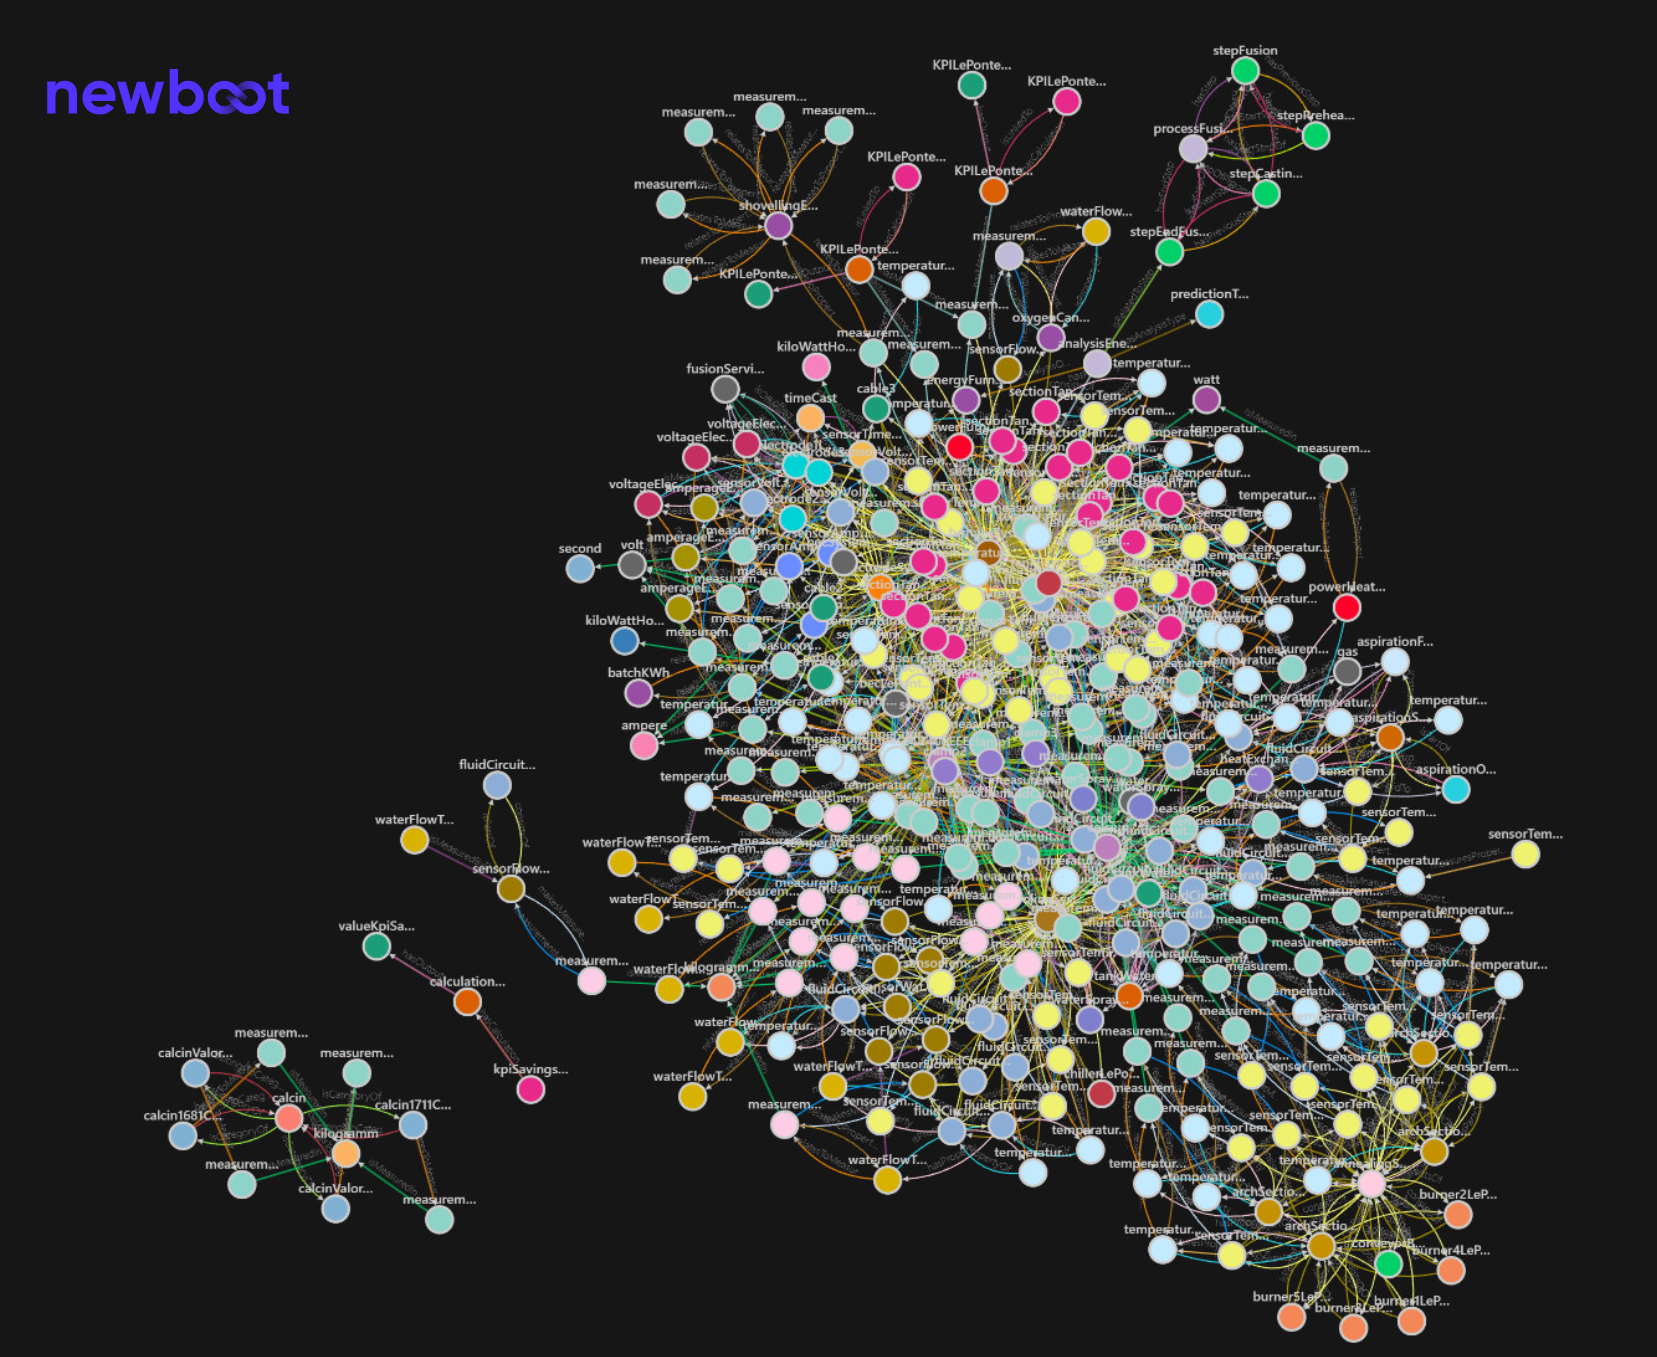
Newboot’s Digital Twins create virtual representations of real-world devices, machines, or processes.
- Live Mapping: Mirrors real-time values, statuses, and alarms from field assets
- Structure Templates: Use reusable twin models per asset type or production line
- Behavior Modeling: Trigger logic based on data changes or threshold events
- Diagnostics & Alerts: Predict failures, detect outliers, or verify system behavior
- AI Orchestration: Route AI model outputs to twin variables for closed-loop control
Each digital twin maintains history, state, and configuration for better traceability.

Applications #
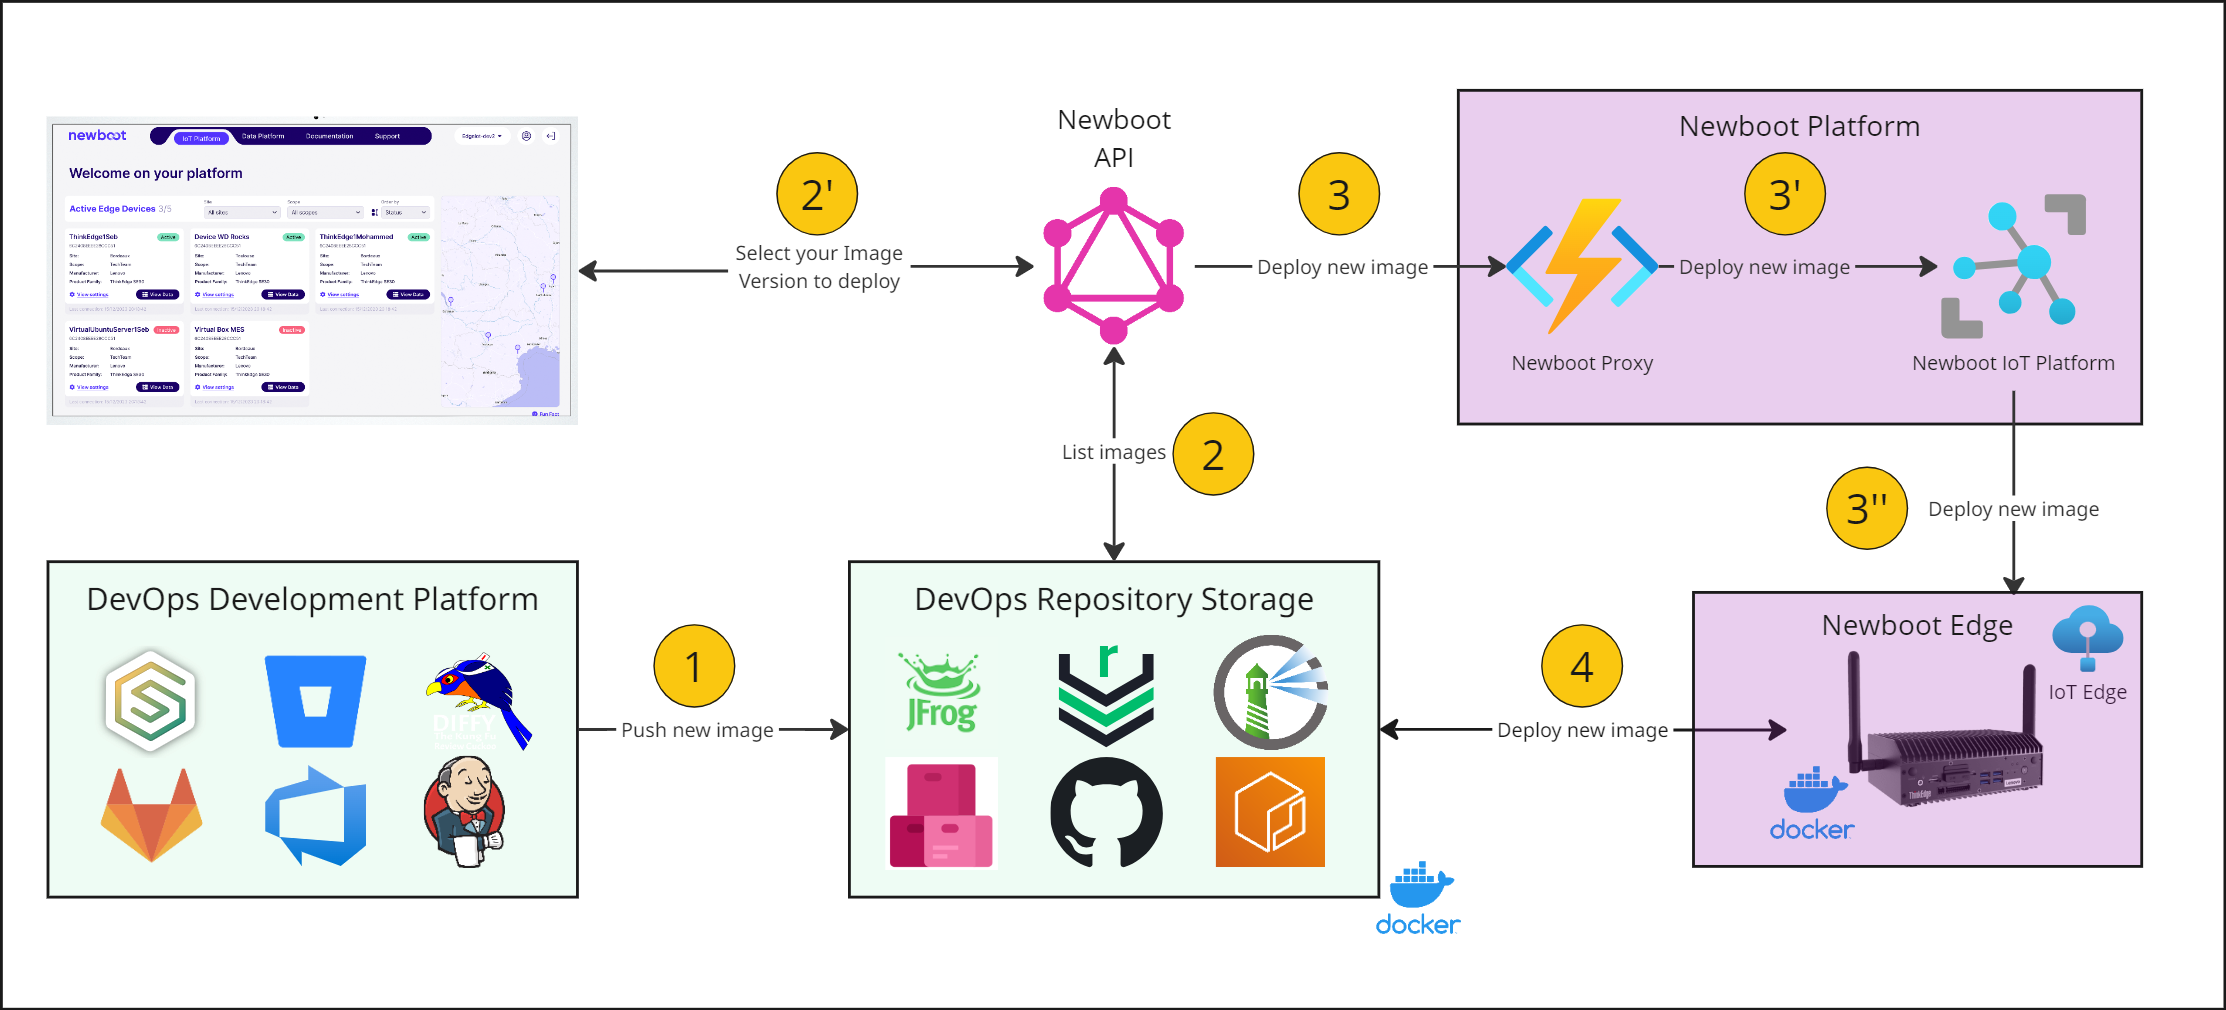
Newboot enables the deployment of custom or off-the-shelf applications directly to edge devices or centrally:
- AI Inference Apps: Deploy trained models to run locally on edge nodes
- Transformation Scripts: Python-based logic for cleaning or enriching signals
- Monitoring Agents: Custom services for quality, energy, or predictive use cases
- User Interfaces: Interactive frontends or dashboards for operators and engineers
Apps are managed through the Webapp and deployed securely with version control.

System #
This section governs the operational aspects of the Newboot runtime and infrastructure:
- Device Monitoring: CPU, RAM, disk usage, connectivity, and uptime
- Module Lifecycle Management: Start/stop/restart containers and drivers
- Security Controls: Certificate management, SSH access, network rules
- User Management: RBAC, SSO, and API token configuration
- Firmware & OS Updates: OTA updates with rollback and versioning
The System view ensures full transparency and control over all edge assets.
Logs #
Logs are essential for auditability, debugging, and compliance. Newboot centralizes all logs with a powerful interface to search, filter, and export entries.
- Operational Logs: Track every interaction or configuration change
- Data Ingestion Logs: Validate incoming data quality and transmission
- Error Logs: Flag failed communications, dropped values, or misconfigured tags
- User Logs: Monitor login attempts, privilege changes, or activity history
- Application Logs: View stdout/stderr outputs of deployed applications
Logs are timestamped, categorized, and searchable for quick issue resolution.


